Dynasty Rebuilds: The Trade Skill That Predicts a Rebound
Losing teams in the best fifth of trade-day negotiating finished top three the next season 24.4% of the time. The worst fifth did it 10.2% of the time, across 3,534 dynasty team-seasons.
This is the audited production snapshot from 2026-08-22. The exact receipt is linked below.
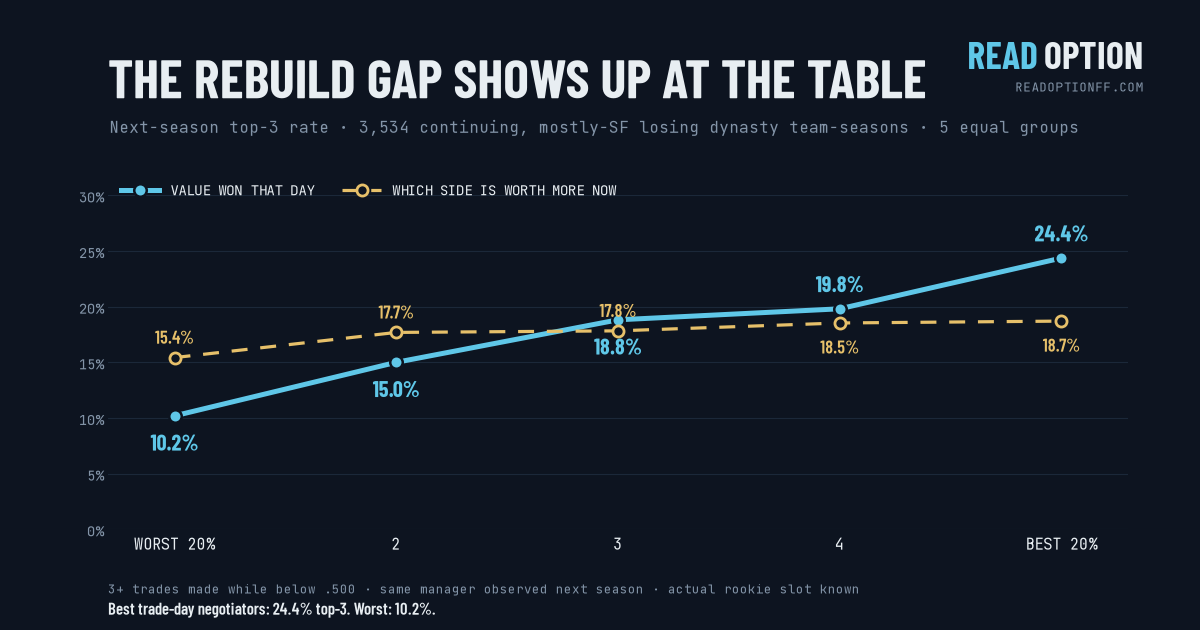
The result
| How the trades graded | Worst 20% | Second | Middle | Fourth | Best 20% |
|---|---|---|---|---|---|
| Value won on trade day | 10.2% | 15.0% | 18.8% | 19.8% | 24.4% |
| Which side is worth more now | 15.4% | 17.7% | 17.8% | 18.5% | 18.7% |
Share finishing top three in the following regular season. Each row sorts the same qualifying team-seasons into five equal groups. The current-value row is not fixed-horizon because older trades have had longer to age.
The raw best-to-worst gap is 14.2 percentage points. After controls for season, league size, how bad the team was, trade timing and volume, points rank, and the rookie slot it earned, the gap is 14.7 points. The manager-block 95% interval is +10.7 to +18.5.
I tried to break it
- 2021 through 2024 only: +13.3 points
- At least five losing-record trades: +18.4 points
- Bottom-third teams only: +12.6 points
- Each team's median trade: +12.1 points
- Remove the most-observed 1% of managers: +13.6 points
45 of 3,579 otherwise-eligible rows had an ambiguous or missing rookie-slot mapping. I excluded them instead of guessing.
Download the exact production receipt (JSON)How it was measured
I started with a team-season, not a manager's career. The team had to finish below .500, make at least three graded trades while already below .500, keep the same manager into the next season, and have a completed rookie draft plus next-season standings on file.
The first sort uses the value won or lost on the day each deal happened. Date-correct 1QB and Superflex values stay on their own scales. The second sort asks which side is worth more at the current snapshot. That is useful context, but not a clean one-year foresight score.
Superflex accounts for 3,065 observations and shows a +15.0-point gap. The 1QB cut has 469 observations and a smaller +8.8-point gap, so I do not treat the exact size as format-neutral.
What this does not prove. This is observational. It does not prove that winning a calculator grade causes wins. Continuing managers must trade again the next year to be observed, and the leagues are the ones people brought into Read Option rather than a random sample of all Sleeper leagues.
Using it
Free to cite, link back if you do. For one specific deal, the trade grader prices the exact assets and checks the trade shape against real clearing behavior. This study explains how to use that price evidence. Is this trade fair? covers the mechanics.