Dynasty Rebuilds: Price Beat the Player Call
Managers who won the price but missed on one-year asset value reached next year's top three 23.2% of the time. Managers who overpaid but picked the better-moving assets got there 11.9% of the time, across 2,947 losing Superflex team-seasons.
This is the audited production snapshot from 2026-08-23. The exact receipt is linked below.
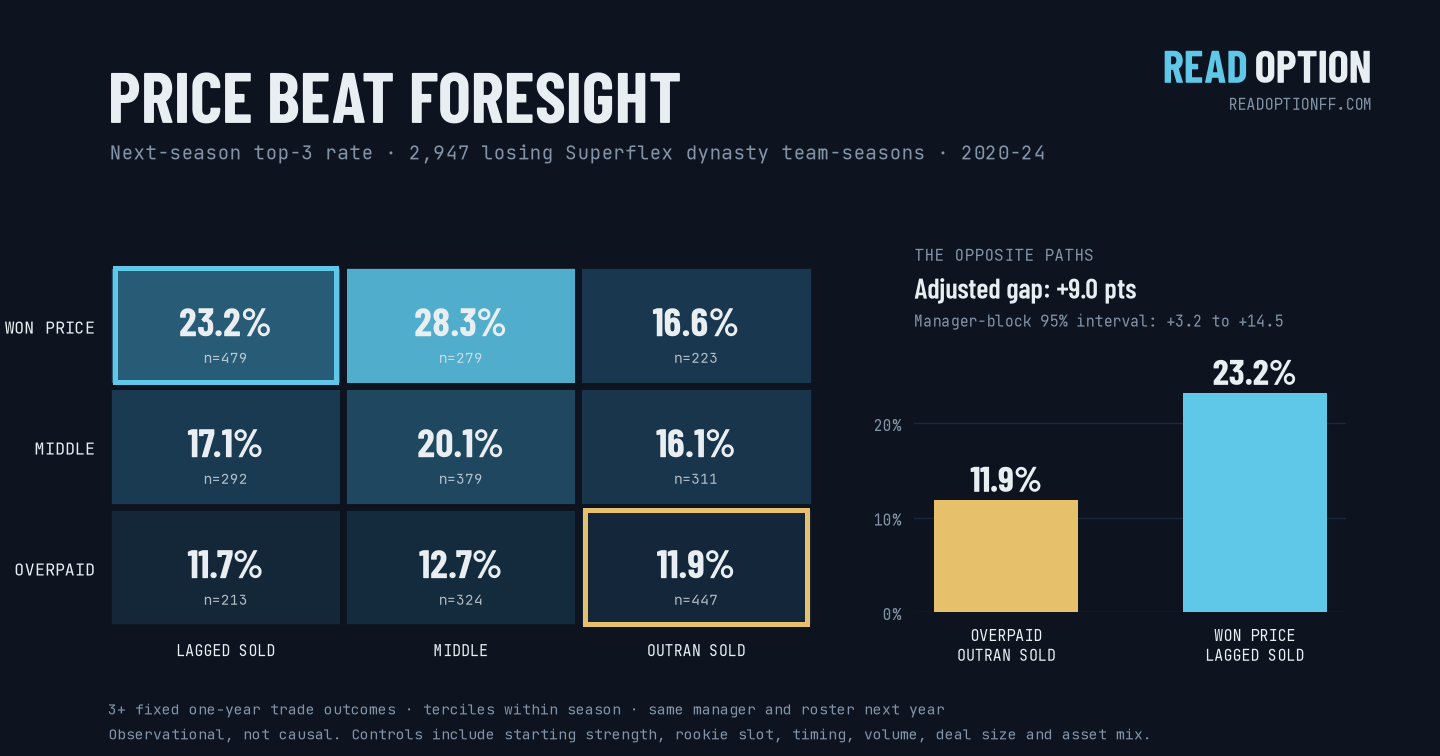
The result
| When price and the asset call disagreed | Team-seasons | Top three next year | Next-year points percentile |
|---|---|---|---|
| Overpaid; acquired assets later outran sold assets | 447 | 11.9% | 31.0 |
| Won the price; acquired assets later lagged sold assets | 479 | 23.2% | 46.3 |
The raw difference is +11.3 percentage points for the group that protected the price. That group landed in the bottom third on one-year relative asset movement. It still finished better.
The obvious problem with that result
The overpay/right-assets group bought far more pick value. That is not a footnote. A different asset mix can create a different timeline, so I reran the comparison with acquired pick-value share, net picks, player counts, and position mix in the adjustment.
The adjusted top-three gap is still +9.0 points. The manager-block 95% interval is +3.2 to +14.5; blocking by league instead gives +3.4 to +14.6.
It also stays positive when the main groups are held fixed inside each acquisition mix:
- Player-heavy acquisitions: +11.6 points
- Mixed acquisitions: +9.8 points
- Pick-heavy acquisitions: +7.1 points
It is not just one cutoff
After adjustment, the price-winning group finished 11.0 points higher in next-season points percentile. The adjusted gaps were +9.6 in standings percentile and +7.4 in win percentage.
I tried to break it
- The sign stays positive in every season from 2020 through 2024.
- Quartile extremes: +15.9 points
- At least four fixed one-year outcomes: +13.1 points
- One observation per manager: +10.3 points
- Keep zero-value endpoints with a bounded measure: +11.6 points
How it was measured
I started with a losing manager in one dynasty league-season. The same manager had to keep the same roster the next year, make at least three graded trades while below .500, have at least three trades with a fixed one-year value outcome, and have a completed next rookie-draft slot on file.
Price is the manager's median acquired-versus-given value margin on the day of each trade. The asset call is the median one-year change in that acquired-versus-given value ratio. In plain terms: did what they bought gain market value relative to what they sold? It is market value, not fantasy points.
I assigned the price and one-year movement groups separately inside each season and format, then used the Superflex sample for the main result. The adjustment also includes starting record, final win rate, points percentile, earned rookie slot, trade timing and count, league size, deal size, and season.
What this does not prove. This is observational. It does not prove that price discipline caused the better finish. The one-year value window overlaps the next season, unmeasured timeline differences may remain, and the qualifying teams are active rebuilders with unusually complete records. The main result is Superflex only; I would not carry the exact size into 1QB.
Using it
Free to cite, link back if you do. For one specific deal, the trade grader prices the exact assets and checks the trade shape against real clearing behavior. This study explains how to use that price evidence. Is this trade fair? covers the mechanics.